RedK Trader Pressure Index (TPX v1.0) Strategy Code
// This source code is subject to the terms of the Mozilla Public License 2.0 at https://mozilla.org/MPL/2.0/
// © RedKTrader
//@version=5
strategy(‘RedK Trader Pressure Index (TPX) Strategy’, shorttitle=‘RedK_TPX_Strategy v5.0’, overlay=false)
length = input.int(title=‘Avg Length’, defval=7, minval=1)
smooth = input.int(title=‘Smoothing’, defval=3, minval=1)
clevel = input.int(title=‘Control Level’, defval=30, minval=5, maxval=100)
pre_s = input.bool(title=‘Pre-smoothing?’, defval=false, inline=‘pre-smoothing’)
pre_sv = input.int(title=”, defval=3, minval=1, inline=‘pre-smoothing’)
R = ta.highest(2) – ta.lowest(2)
hiup = math.max(ta.change(high), 0)
loup = math.max(ta.change(low), 0)
bulls = math.min((hiup + loup) / R, 1) * 100 //prevent big gaps causing a % over 100%
avgbull = ta.wma(nz(bulls), length)
avgbulls = pre_s ? ta.wma(avgbull, pre_sv) : avgbull
hidn = math.min(ta.change(high), 0)
lodn = math.min(ta.change(low), 0)
bears = math.max((hidn + lodn) / R, -1) * -100 //convert to positive value
avgbear = ta.wma(nz(bears), length)
avgbears = pre_s ? ta.wma(avgbear, pre_sv) : avgbear
net = avgbulls – avgbears
TPX = ta.wma(net, smooth) // final smoothing
col_bulls = #33ff0099 // 40% transp
col_bears = #ff111166 // 60% transp
col_level = #ffee0070
col_TPXup = color.white
col_TPXdn = color.gray
TPXBullish = TPX > 0
hline(0, color=col_level, linestyle=hline.style_solid, linewidth=1, editable=false)
hline(clevel, title=‘Control Level’, color=col_level, linestyle=hline.style_dotted, linewidth=2)
plot(avgbulls, title=‘Bull Pressure’, color=col_bulls, style=plot.style_area, linewidth=3)
plot(avgbears, title=‘Bear Pressure’, color=col_bears, style=plot.style_area, linewidth=3)
plot(TPX, title=‘Net Pressure’, color=TPXBullish ? col_TPXup : col_TPXdn, linewidth=3)
slevel_on = input.bool(title=‘Pressure Signal Line?’, defval=false, inline=‘signal’)
slevel = input.int(title=”, defval=70, minval=0, maxval=100, step=5, inline=‘signal’)
maxbulls = avgbulls >= clevel
maxbears = avgbears >= clevel
TPXswing = ta.cross(TPX, 0)
if (maxbears and slevel_on)
strategy.entry(“Sell”, strategy.short, comment=“Sell”)
if (maxbulls and slevel_on)
strategy.entry(“Buy”, strategy.long, comment=“Buy”)
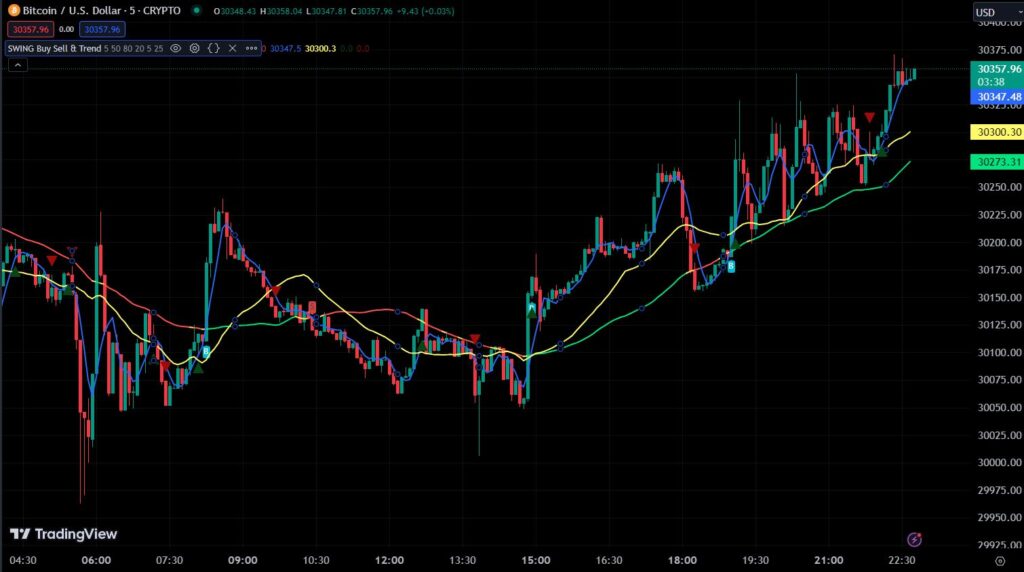
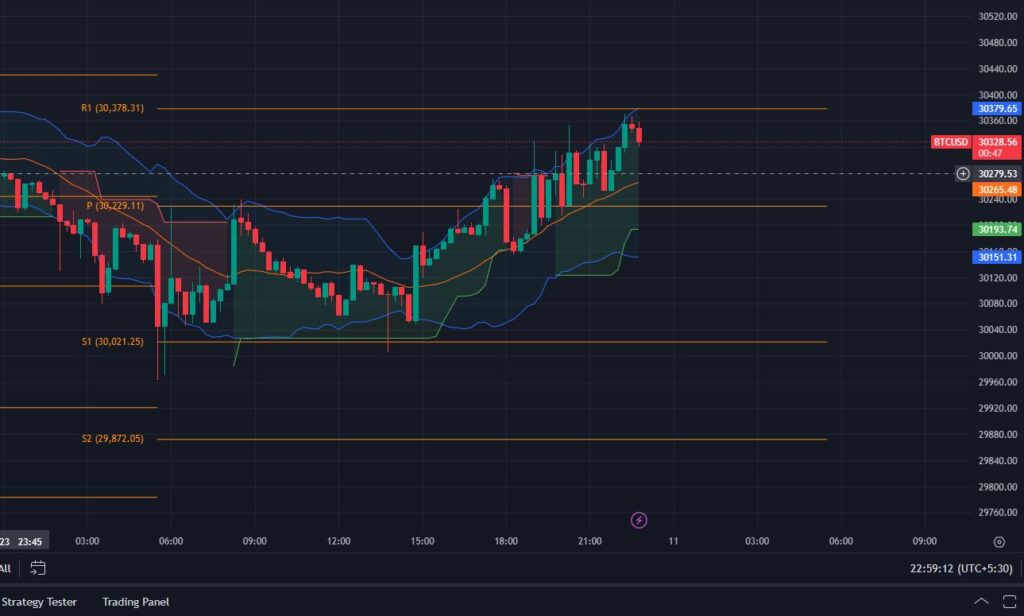
Stock to Watch on 05/04/2023 - PPT

Strategy 5 Pine Script
//@version=4
//resued the code ut bot
study(title=“AKSTALKS Ut bot”, overlay = true)
// CREDITS to HPotter for the orginal code.
// CREDITS to HPotter for the orginal code.
// Credits to ut bot developed by Yo_adriiiiaan.
// I just changed few values of ATR period and key values for buy and sell.
src = close
keyvalue = input(2, title = “Key Vaule. ‘This changes the sensitivity'”, step = .5)
atrperiod = input(3, title=“ATR Period”)
xATR = atr(atrperiod)
nLoss = keyvalue * xATR
xATRTrailingStop = 0.0
xATRTrailingStop := iff(src > nz(xATRTrailingStop[1], 0) and src[1] > nz(xATRTrailingStop[1], 0), max(nz(xATRTrailingStop[1]), src – nLoss),
iff(src < nz(xATRTrailingStop[1], 0) and src[1] < nz(xATRTrailingStop[1], 0), min(nz(xATRTrailingStop[1]), src + nLoss),
iff(src > nz(xATRTrailingStop[1], 0), src – nLoss, src + nLoss)))
pos = 0
pos := iff(src[1] < nz(xATRTrailingStop[1], 0) and src > nz(xATRTrailingStop[1], 0), 1,
iff(src[1] > nz(xATRTrailingStop[1], 0) and src < nz(xATRTrailingStop[1], 0), -1, nz(pos[1], 0)))
xcolor = pos == -1 ? color.red: pos == 1 ? color.green : color.blue
plot(xATRTrailingStop, color = xcolor, title = “Trailing Stop”)
sell = crossunder(src,xATRTrailingStop)
barcolor = src > xATRTrailingStop
plotshape(sell, title = “Sell”, text = ‘Sell’, style = shape.labeldown, color= color.red,textcolor = color.white, size = size.tiny)
barcolor(barcolor? color.green:color.red)
alertcondition(sell, title=‘UT BOT Sell’, message=‘UT BOT Sell’)
keyvalue1 = input(2, title = “Key Vaule. ‘This changes the sensitivity'”, step = .5)
atrperiod1 = input(300, title=“ATR Period”)
xATR1 = atr(atrperiod1)
nLoss1 = keyvalue1 * xATR1
xATRTrailingStop1 = 0.0
xATRTrailingStop1 := iff(src > nz(xATRTrailingStop1[1], 0) and src[1] > nz(xATRTrailingStop1[1], 0), max(nz(xATRTrailingStop1[1]), src – nLoss1),
iff(src < nz(xATRTrailingStop1[1], 0) and src[1] < nz(xATRTrailingStop1[1], 0), min(nz(xATRTrailingStop1[1]), src + nLoss1),
iff(src > nz(xATRTrailingStop1[1], 0), src – nLoss1, src + nLoss1)))
pos1 = 0
pos1 := iff(src[1] < nz(xATRTrailingStop1[1], 0) and src > nz(xATRTrailingStop1[1], 0), 1,
iff(src[1] > nz(xATRTrailingStop1[1], 0) and src < nz(xATRTrailingStop1[1], 0), -1, nz(pos1[1], 0)))
xcolor1 = pos1 == -1 ? color.red: pos1 == 1 ? color.green : color.blue
plot(xATRTrailingStop1, color = xcolor1, title = “Trailing Stop”)
buy = crossover(src,xATRTrailingStop1)
barcolorr = src > xATRTrailingStop1
plotshape(buy, title = “Buy”, text = ‘Buy’, style = shape.labelup, location = location.belowbar, color= color.green,textcolor = color.white, size = size.tiny)
barcolor(barcolorr? color.green:color.red)
alertcondition(buy, title=‘UT BOT Buy’, message=‘UT BOT Buy’)